Glendale, Skye - Tourist Guide

Aurora Borealis - Phases
The Lifecycle of an Aurora
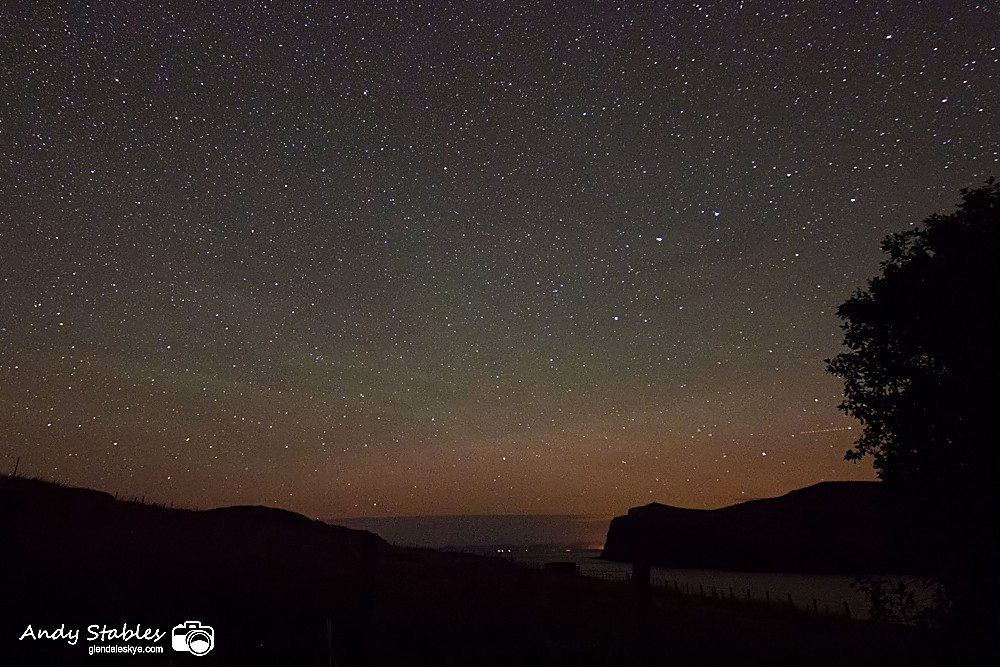
Diffuse Aurora : November 18th, 2014 22:13 UT
An aurora, or what scientists call a 'Geomagnetic Substorm' or 'Polar Magnetic Substorm', goes through three distinct phases:
- Growth
- Expansion
- Recovery
The Expansion Phase is the one that aurora-hunters seek, as this is when the aurora explodes into the brightest colours and biggest rays. It is when the magnetometers dip sharply downwards.
The Growth Phase usually starts around 1-2 hours before the expansion phase, although it can start several hours before. It is where we see a very slow fading-in of the aurora as a pink/red band that is approximately 10 degrees high on the Isle of Skye and sits above the horizon. It typically coincides with a climb in the magnetometer plots. This type of aurora is called a 'diffuse aurora'. During the growth phase, the diffuse aurora gets brighter and the discrete green arc begins to rise up over the horizon inside it. We can use this to get advance warning of the expansion phase and approximate when it might start.
In the Recovery Phase, the intense burst of activity during the expansion phase is waning and the magnetometers are returning to background levels.
Magnetometer Plots During A Geomagnetic Substorm
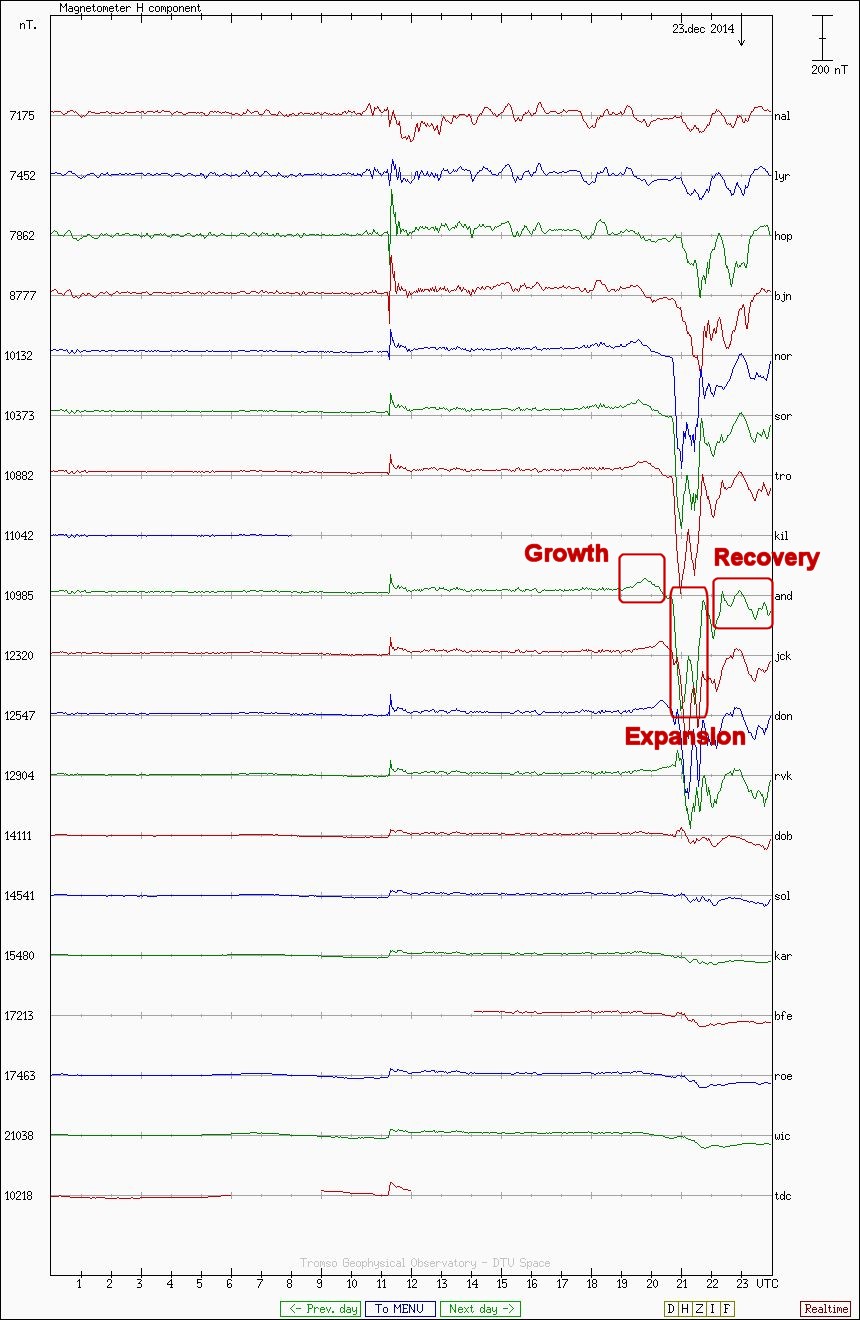
Phases of a Geomagnetic Substorm
The magnetometer plot on the left shows the signature of a typical geomagnetic substorm. The growth phase in this example lasted for 1.5 hours, the expansion phase lasted for 1 hour and then the recovery phase continued for at least three hours.
It is the diffuse aurora in the Growth Phase that gives us an insight into when the Expansion Phase will occur and also how good the discrete aurora in the Expansion Phase will be.
The amount of rise in the magnetometer plots during the growth phase can be so subtle as to be almost impossible to distinguish from background levels. It can also be very pronounced.
Auroras can be photographed in the sky during all three phases, so using a magnetometer to look for auroras is not simply a case of "big dips equals aurora". If we are in a recovery phase, there can still be a very strong aurora some hours after magnetometers have returned to background levels. Also, towards the end of the growth phase there can be a strong aurora when there is a powerful solar wind, e.g. from a CME.
The following sequence of images illustrate how each stage of the geomagnetic substorm, and corresponding development of the aurora, appears on camera.
Ten Stages of a Geomagnetic Substorm
Sequence 1 - Coronal Hole High-Speed Stream
Taken on October 15th, 2014. The entire sequence is shot at ISO 6400 F2.8 30s 16mm on a Canon 70D fitted with a Tokina 11-16mm F2.8 lense.
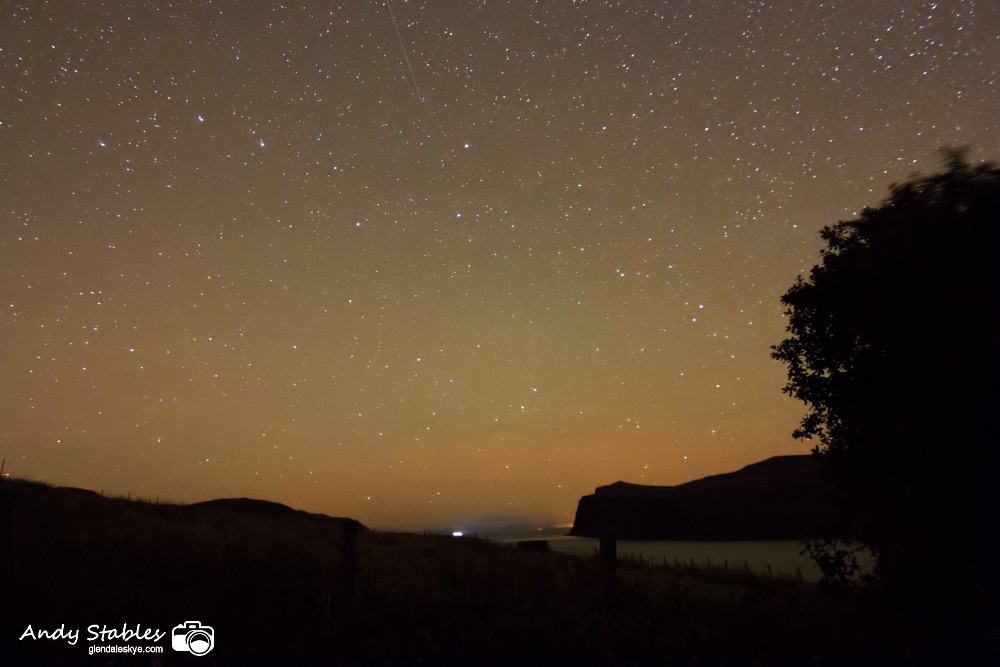
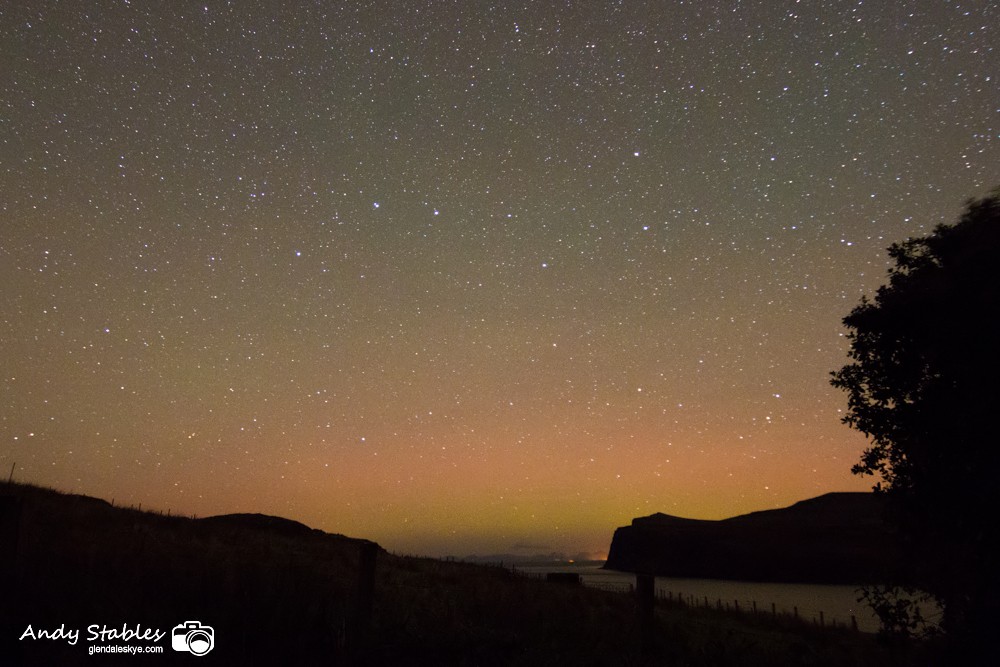
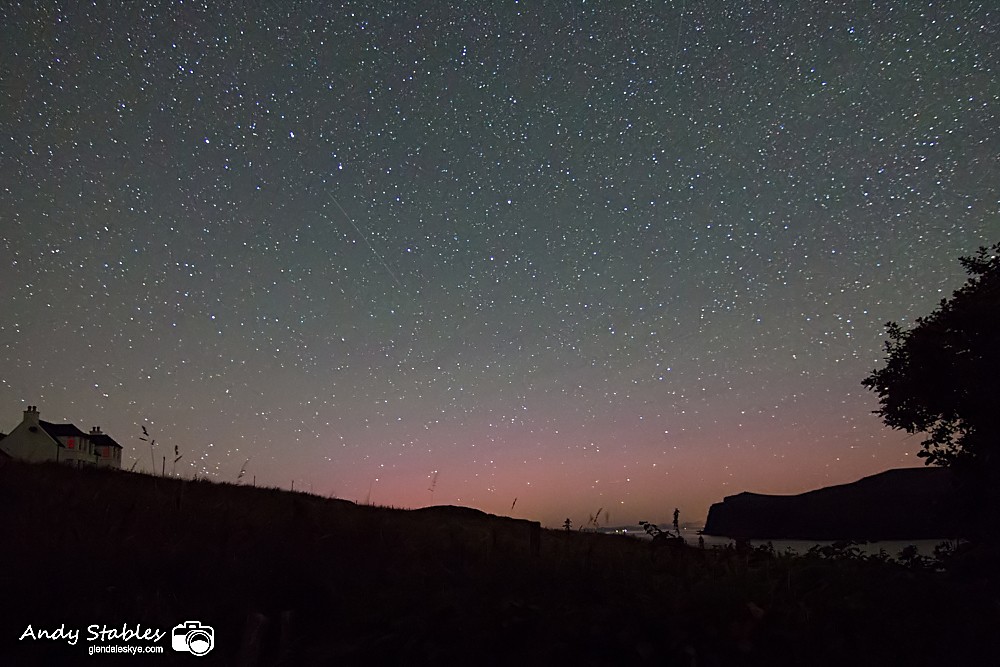
STAGE 1 : 19:38 UT
Geomagnetic Substorm Growth Phase
STAGE 1
19:38 UT : This looks like an ambient sky. The whole of it is covered with bands and blotches of airglow in both green and pink tones. However, look closely at the horizon, and over Dunvegan Head to the right of the image, and you will notice a distinct reddish/pink band that is a darker shade to the airglow. This is a diffuse aurora beginning to fade in over the horizon.
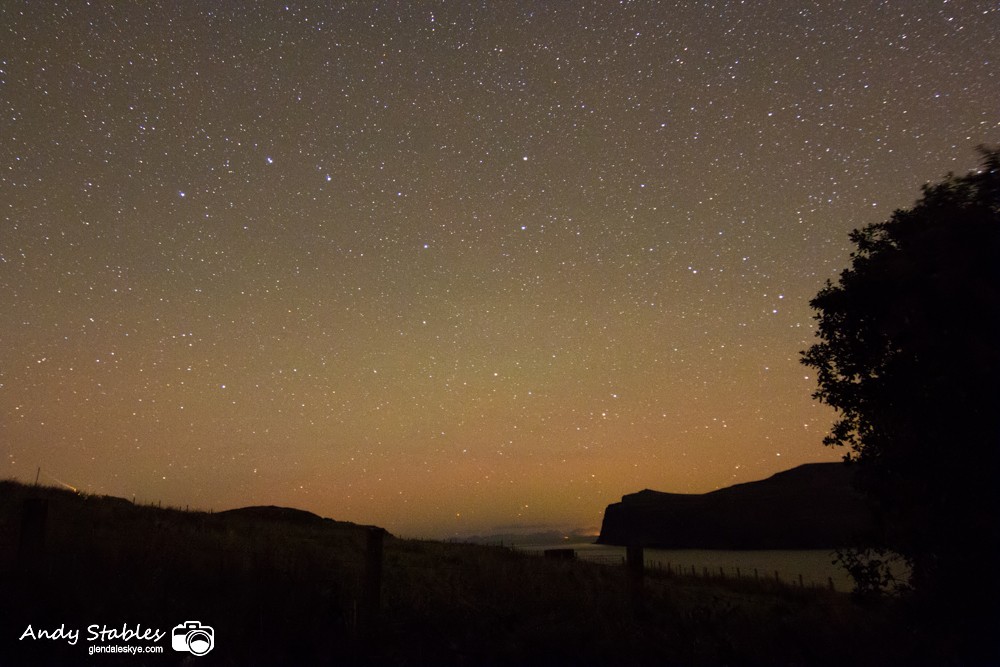
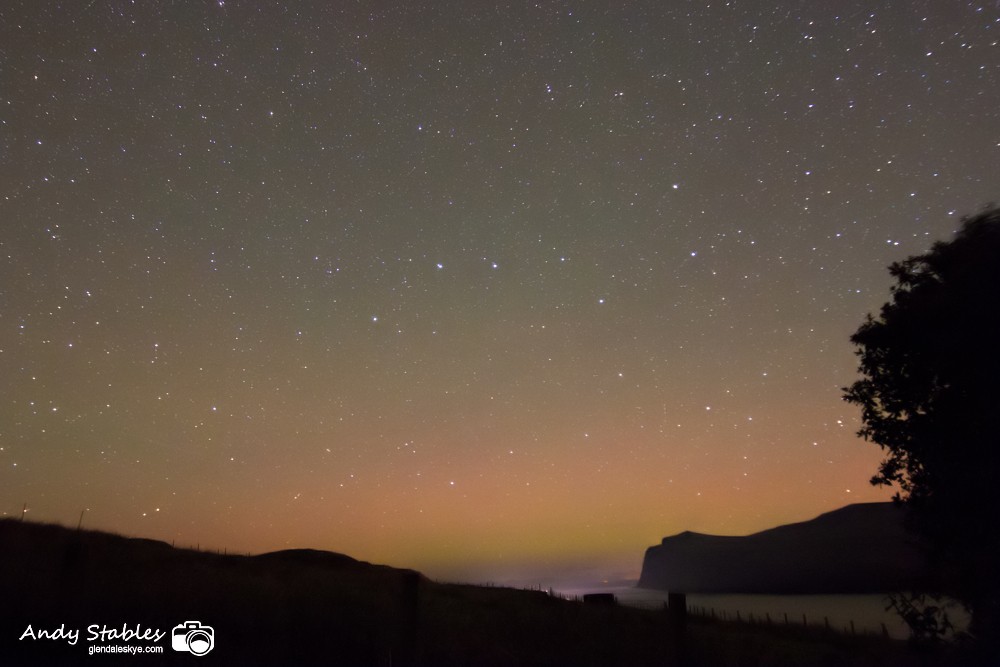
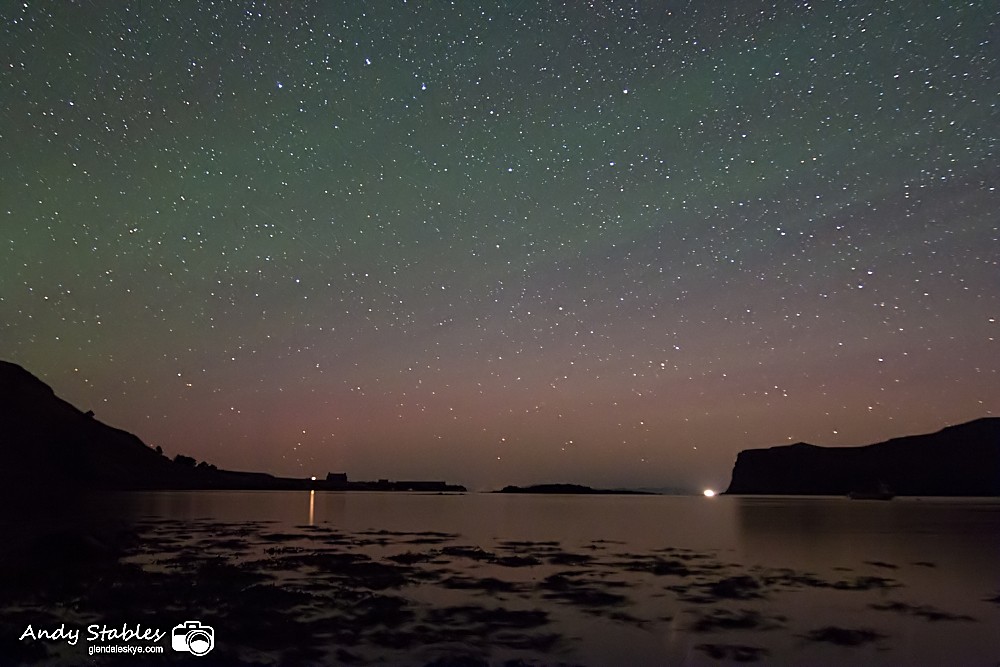
STAGE 2 : 20:02 UT
STAGE 2
20:02 UT : Notice how over the course of 20 minutes our diffuse aurora has deepened in colour and also notice that a shadow is appearing just above the sea. This shadow is the embryo green arc beginning to form.
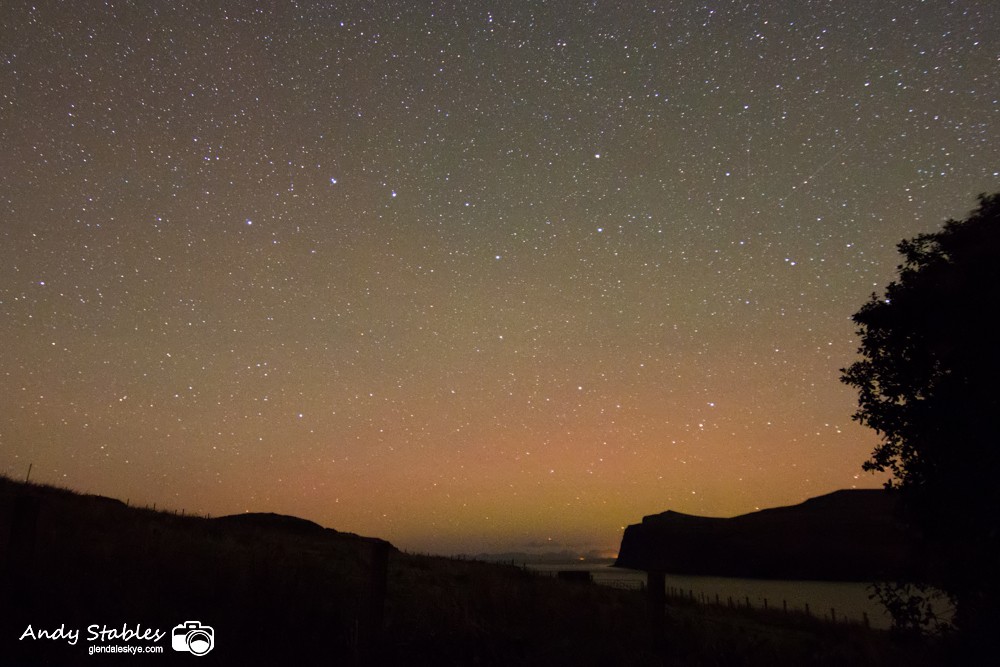
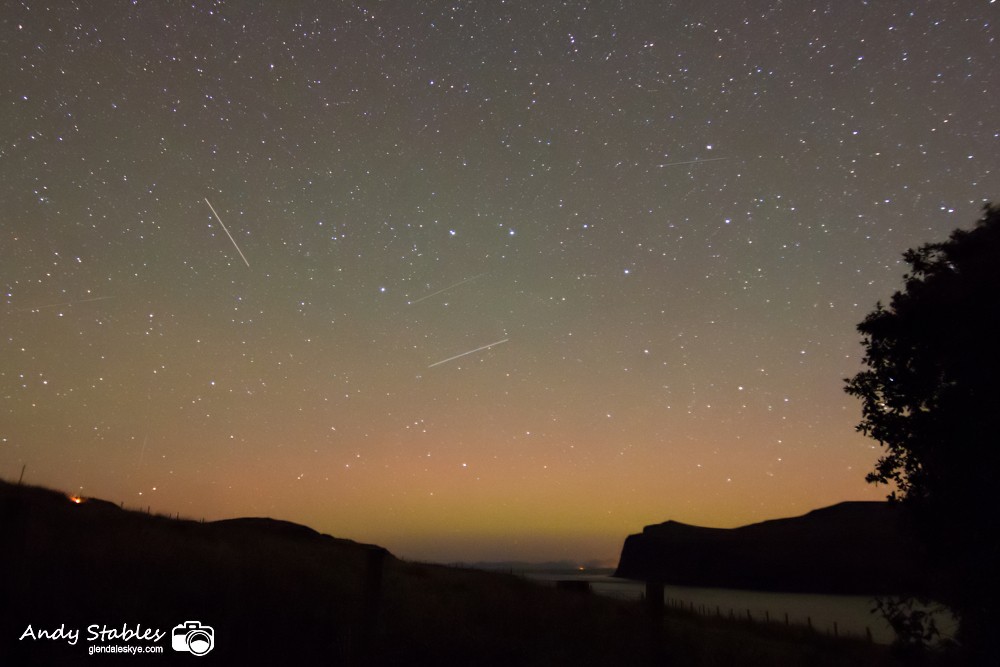
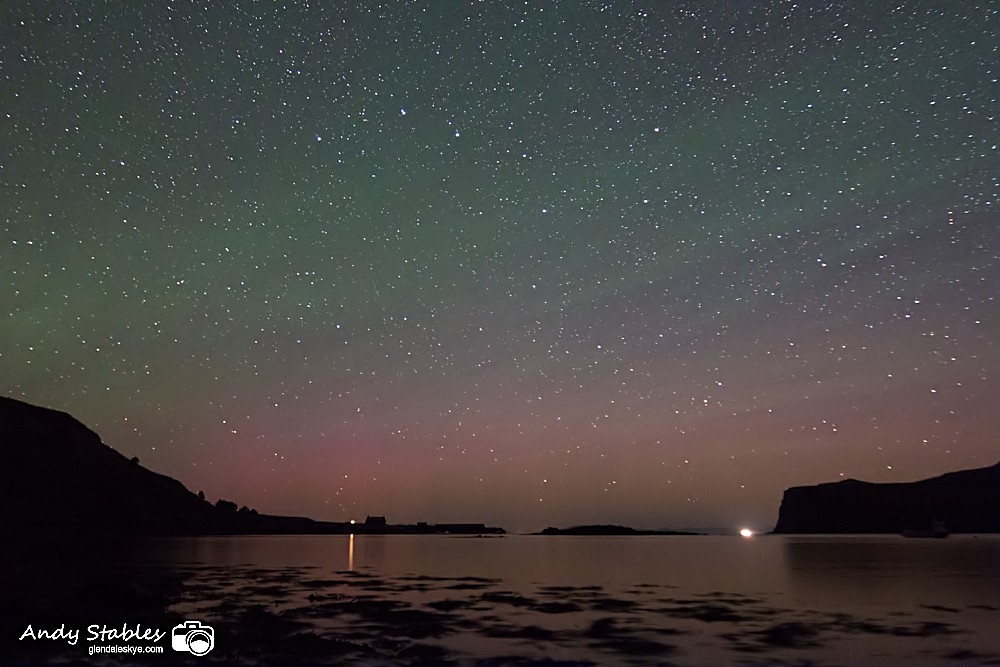
STAGE 3 : 20:36 UT
STAGE 3
20:36 UT : Another 35 minutes has passed and now the 'shadow' has expanded to cover the lower half of the aurora above the sea. The aurora is just beginning to become discrete, which is where it splits into two distinct bands of pink and green. The top has deepened in colour and its edge is becoming sharper. There is now a very noticeable contrast between the pink auroral arc and the rest of the sky.
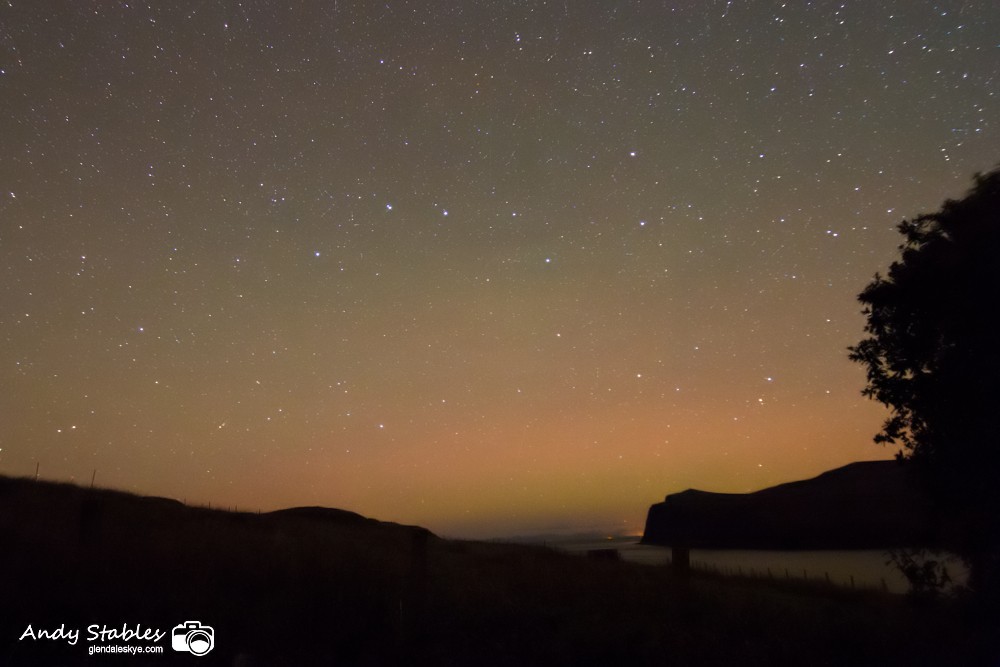
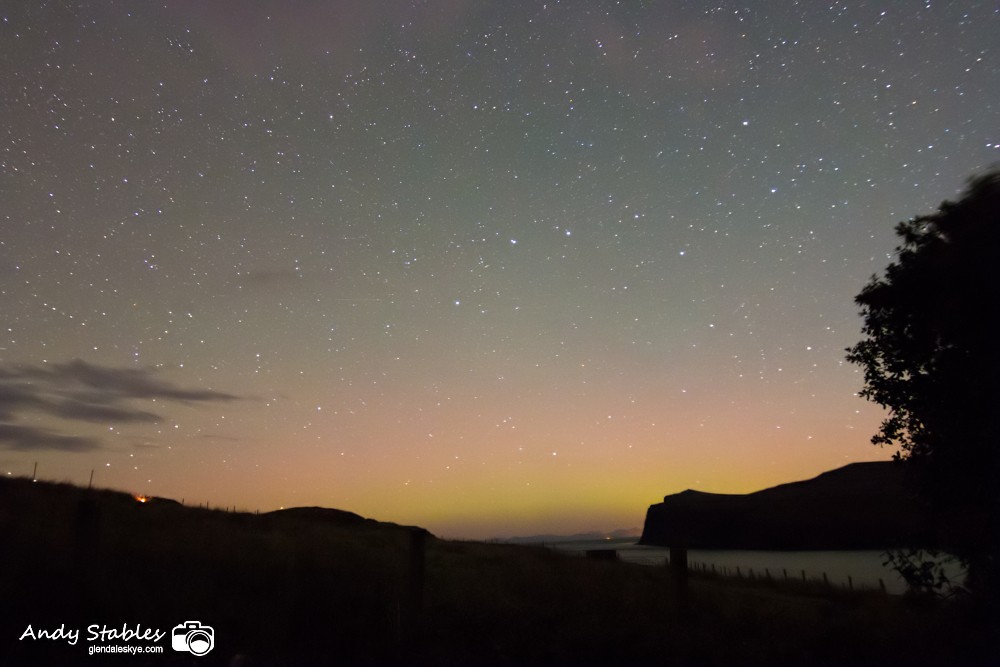
STAGE 4 : 20:59 UT
STAGE 4
20:59 UT : Another 20 minutes elapsed and the aurora is now clearly discrete, with a defined green arc below the pink top. It is at this stage that I would start preparing to send out the text alert, over an hour and a half after I started monitoring the escalation of the aurora. The magnetometers will not start to dip for another 30 minutes.
STAGE 5 : 21:28 UT
STAGE 5
21:28 UT : The green is now strong enough for me to send out the text alert, safe in the knowledge that everyone receiving it will clearly see an aurora on the back of their camera when they take a photo. This is the point at which the magnetometers begin to dip sharply. However, if you were watching the magnetometers at this stage, you would have no knowledge of what they were about to do. Look very closely and you will notice a dark shadow appearing underneath the green arc, as it begins to come clear of the horizon. This is the dark, night sky showing beneath the aurora.
This is the end of the Geomagnetic Substorm Growth Phase.
STAGE 6 : 21:45 UT
Geomagnetic Substorm Expansion Phase
STAGE 6
21:45 UT : The magnetometers have dipped sharply to almost 200 nT at Andenes. The aurora is now well clear of the horizon and there is a wide dark shadow below the green arc, where the clear, dark night sky is showing through below.
STAGE 7 : 21:56 UT
STAGE 7
21:56 UT : The magnetometers have now hit their maximum dip of around 350 nT at Andenes. Look closely at the green arc and you will notice some shadows in it. This is embryo structure and on a better night rays would start to emerge.
STAGE 8 : 22:16 UT
Geomagnetic Substorm Recovery Phase
STAGE 8
22:16 UT : The magnetometers are now returning to background but still dipped by 300 nT at Andenes. There are still the shadows of embryo structure within the green arc and the green is becoming stronger. The pink top is becoming patchy, which is how embryo structure begins to show, unfortunately, it does not develop further on this occasion.
STAGE 9 : 22:31 UT
STAGE 9
22:31 UT : The magnetometers are back to 200 nT at Andenes. Pinks continue to fade but greens get brighter.
STAGE 10 : 22:56 UT
STAGE 10
22:56 UT : The magnetometers are back to background levels at Andenes. Pinks are still fading but greens are now at their brightest of this sequence. Green begins to dominate.
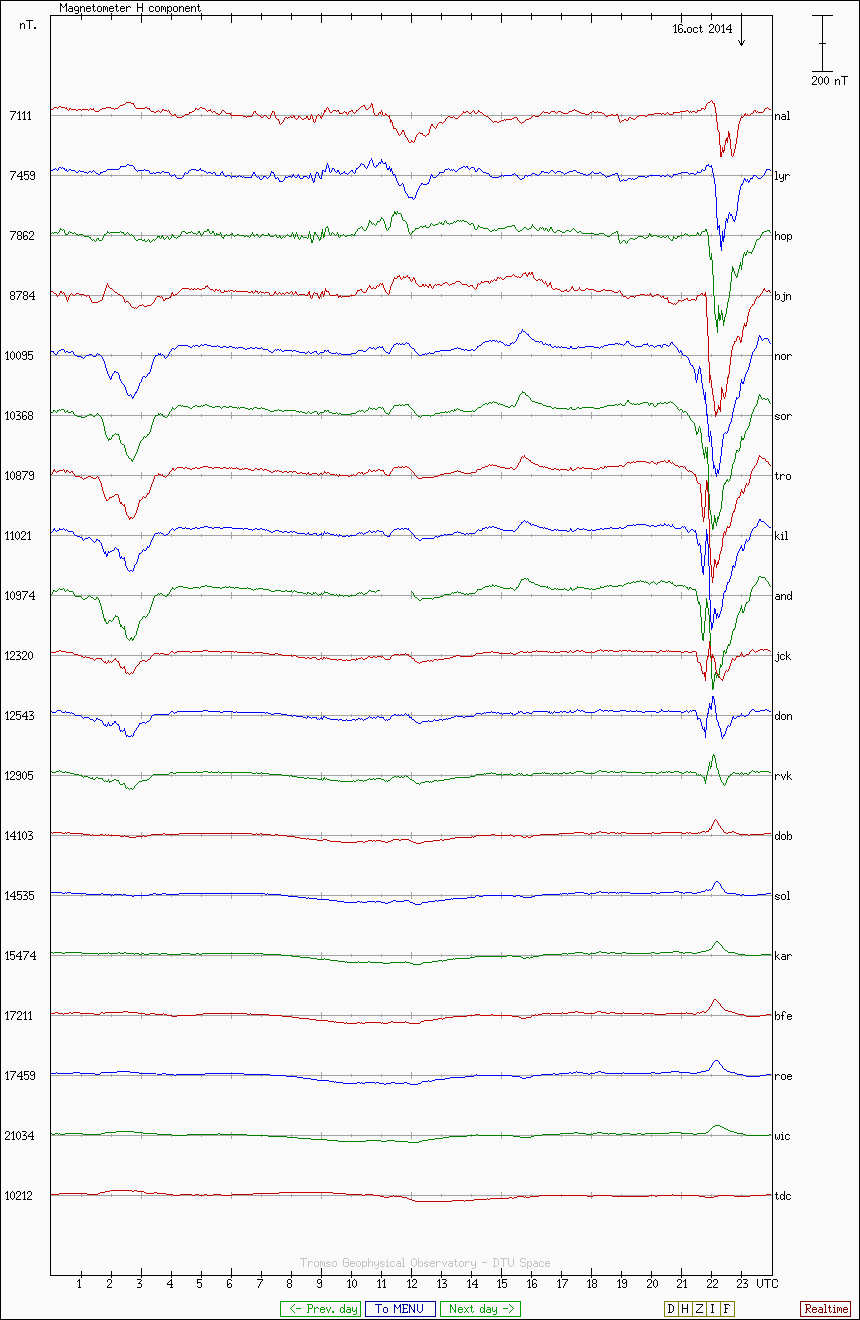
Norwegian-Line Magnetometer Stack
during this sequence.
This is how the magnetometers looked during this sequence. The growth phase started at 14:00 UT but there was barely any noticeable rise in the magnetometer plots. The magnetometers didn't dip sharply until two hours after I first detected the aurora on camera. This is why I always monitor the night sky when hunting auroras, rather than relying on the magnetometer plots.
Over 100 substorms that I have photographed here on the Isle of Skye have followed this exact pattern that I have described above.
In this sequence I had detected the aurora on camera almost two hours before the expansion phase, ordinarily this lead time is around 1 hour but can be as short as 30 minutes.
I am only studying the auroral growth phase but, once an aurora has reached the recovery stage, they generally continue for at least a couple of hours after the magnetometers return to background levels.
Sequence 2
Taken on August 26th, 2014. The entire sequence is shot at ISO 6400 F2.8 30s 16mm on a Canon 70D fitted with a Tokina 11-16mm F2.8 lense.
This sequence gives a detailed look at what happens in Stages 6 to 8 (The Geomagnetic Substorm Expansion Phase) when the aurora is more intense and goes on to produce structure.
During Growth Phase : 22:34 UT
22:34 UT : This image sets the scene for how the sky had looked an hour before the expansion phase started in earnest. It is at Stage 5, as you can clearly see that the aurora is becoming discrete and showing hints of structure.
There are some faint bands of airglow structure forming across the whole sky above the aurora.
Now we skip forward 1 hour to the Expansion Phase.
1 of 6 : 23:28 UT
Geomagnetic Substorm Expansion Phase
23:28 UT : Again, this looks like an ambient sky, although now the airglow is exceptionally strong. Many people look at an image like this and assume that everything they see is airglow. However, look closely at the pink band above the horizon and you will see that it actually has a grey band of 'shadow' over the horizon. The 'shadow' is a combination of the green arc forming and clear sky showing underneath. You will also notice that there are some vertical shadows on the left of the band above the horizon, where embryo structure is forming. This pink band is actually a diffuse aurora at an advanced stage, corresponding to 'Stage 7' in the sequence above.
2 of 6 : 23:29 UT
23:29 UT : Just a minute later and you can see see how the pinks are becoming blotchy on the left of the aurora and vertical shadows are showing across the entire band, which is starting to turn green in the middle. These shadows and blotches are the structure continuing to form. The diffuse aurora is escalating rapidly and already becoming discrete. The stackplot at Andenes is already dipped by 200 nT at this point and is about to make a further sudden sharp dip.
3 of 6 : 23:30 UT
23:30 UT : After another minute, the pink blobs of structure on the left are intensifying. The shadowy area underneath the pink arc is showing some green rays towards the right.
4 of 6 : 23:32 UT
23:32 UT : After a couple more minutes, the aurora explodes into rays. The three distinct bands of grey (clear sky), then green, then pink can clearly be seen above the sea, with rays running vertically through them, right down to the horizon.
It is also worth noticing that airglow is a totally different shade of green to that within the aurora.
5 of 6 : 23:34 UT
23:34 UT : This was the point at which the magnetometers reached their maximum displacement at Andenes of 450 nT. The burst of rays continue for another few minutes.
6 of 6 : 23:40 UT
23:40 UT : Suddenly the rays are 'gone' and we are back to our 'ambient-looking' sky from the first stage of this sequence. However, close inspection reveals that the three distinct bands of grey, green and pink are still just discernible and the arcs are still slightly blotchy where there are traces of weak structure. The stackplot displacement at Andenes is now just 250 nT, as the magnetometers return sharply towards background levels. This is the start of the Geomagnetic Substorm Recovery Phase.
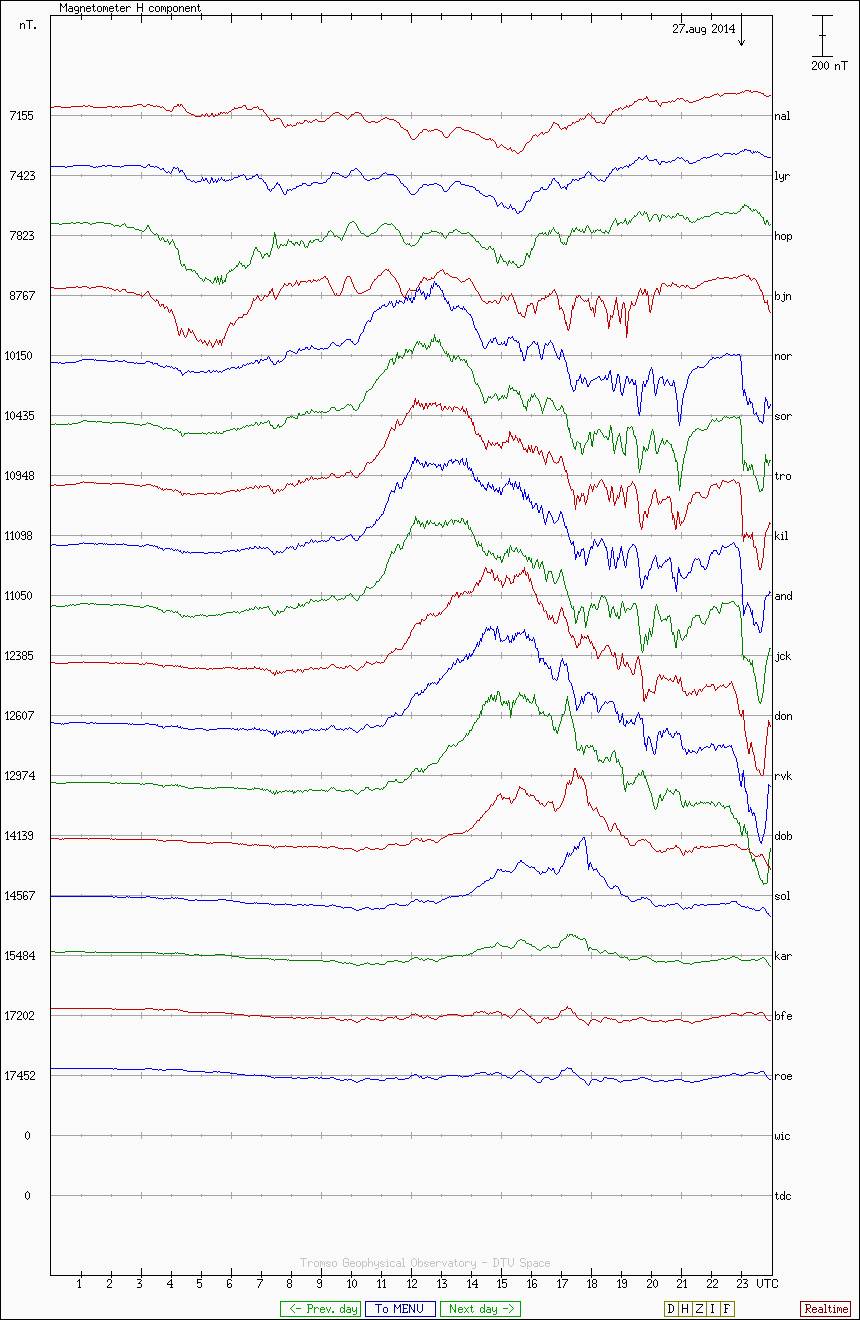
Norwegian-Line Magnetometer Stack
during this sequence.
This was the stackplot trace during this sequence.
The line to watch is the one labelled 'and' for Andenes in Norway.
Notice that there was a very strong Growth Phase that started at 10:15 UT. Expansion actually started tentatively at 17:15 UT but then stalled until 22:30 UT when it started properly.
Sequence 3 - Coronal Mass Ejection
This sequence gives a detailed look at the chain of events that occur following the detection of a Coronal Mass Ejection at the ACE Satellite, which is located 1 million miles from the Earth on a line-of-sight between the Sun and the Earth.
Taken on December 23rd, 2014. The entire sequence is shot at ISO 6400 F2.8 30s 16mm on a Canon 70D fitted with a Tokina 11-16mm F2.8 lense.
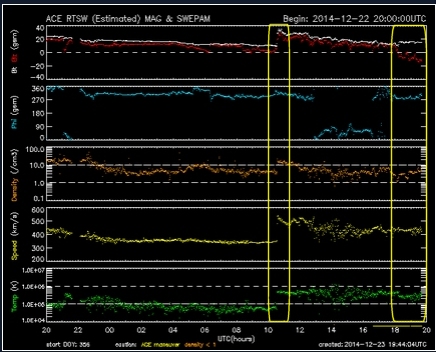
24-Hour Solar Wind Parameters on December 23rd, 2014
At 10:15 UT, there is a sudden step increase in the solar wind speed/density and the Interplanetary Magnetic Field (IMF) strength/direction (Bt/Bz), which indicates the arrival of a Coronal Mass Ejection at the ACE measuring satellite. The Bz value pushes firmly North (positive).
At 18:15 UT, the Bz measured at ACE suddenly goes South (negative). Forty-five minutes later, at 19:00 UT, this negative IMF will arrive at Earth.
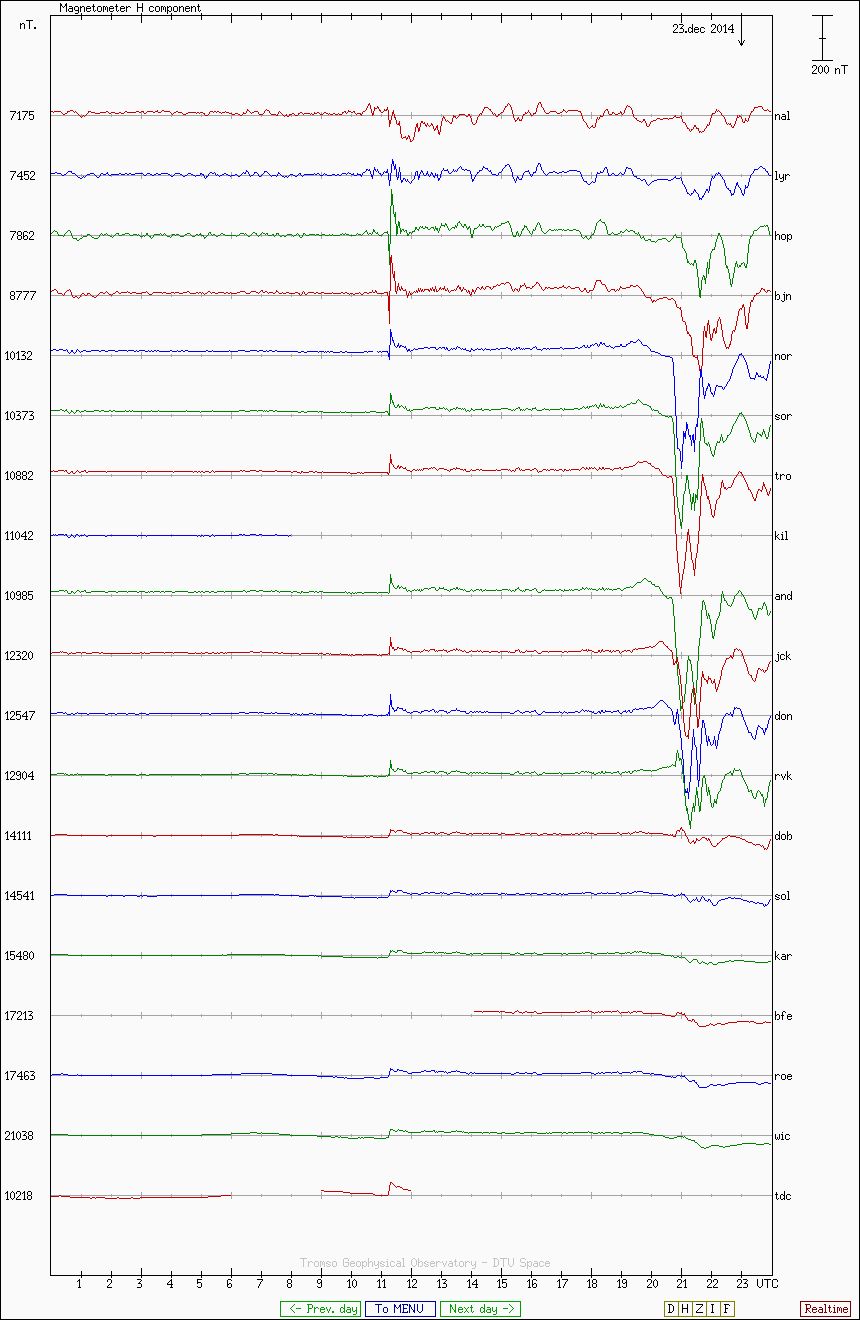
Norwegian-Line Magnetometer Stack
during this sequence.
The solar wind takes approximately 45-60 minutes to reach Earth from ACE and ACE detected the CME at 10:15 UT. If you look at the magnetometer stackplot, you will notice a sharp upwards reaction on the magnetometers at 11:05 UT, as the CME itself arrives at Earth. This event is called a 'Sudden Geomagnetic Impulse' or SGI. The positive Bz inhibits development of a substorm, so the magnetometers quickly return to background levels.
The line to watch is the one labelled 'and' for Andenes in Norway.
The fun starts at 19:00 UT, when the negative Bz arrives at Earth. We see the magnetometers start to climb slowly, as the Growth Phase of a Geomagnetic Substorm begins.
Notice how the climb in the stackplot line at Andenes is very subtle, which means it is difficult from the graphs alone to be certain that a substorm is actually in progress. However, here in Glendale on the Isle of Skye, we can confirm that a substorm is in progress by taking photos of the sky, as follows.
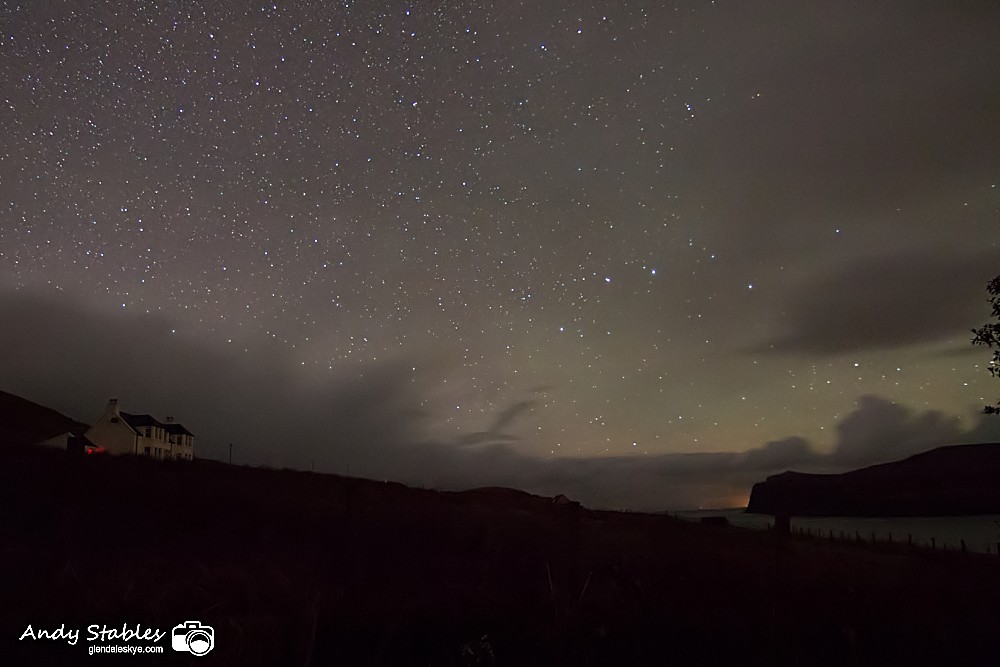
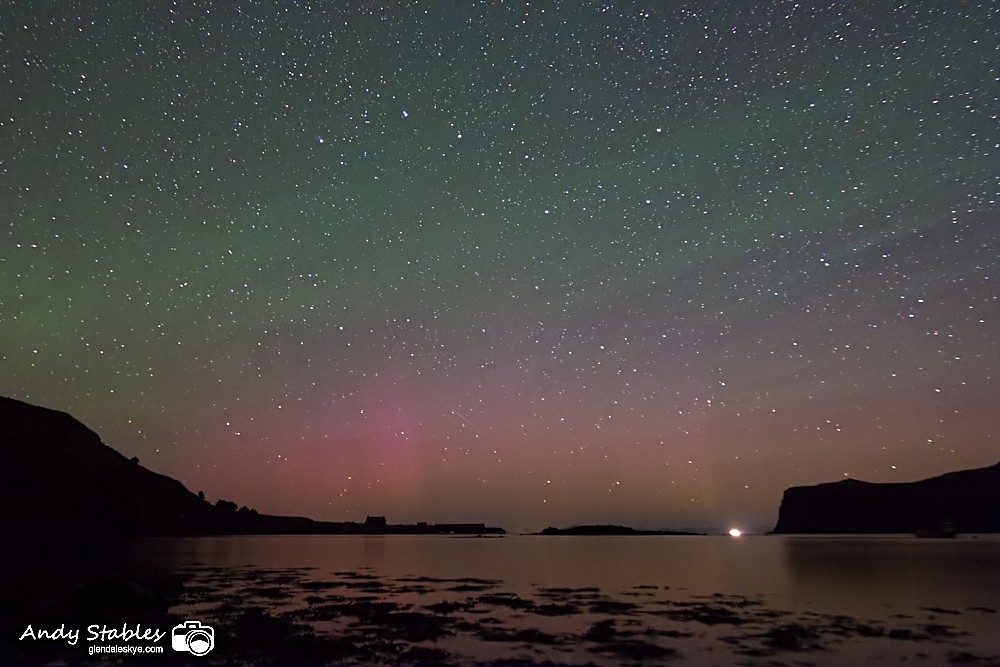
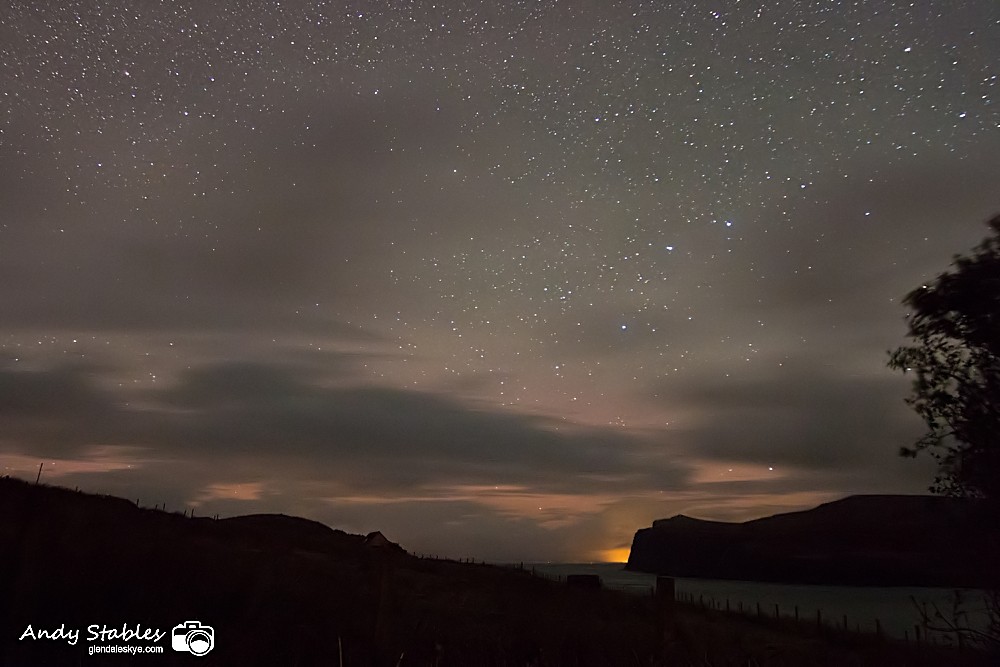
1 of 4 : 18:05 UT - Ambient
Before the Substorm
The Geomagnetic Substorm does not begin on Earth until 19:00 UT, so let us look at a photograph of the sky here in Glendale taken at 18:05 UT, before the Growth Phase begins.
There is no trace of any aurora and we have a totally ambient sky, with just the usual airglow.
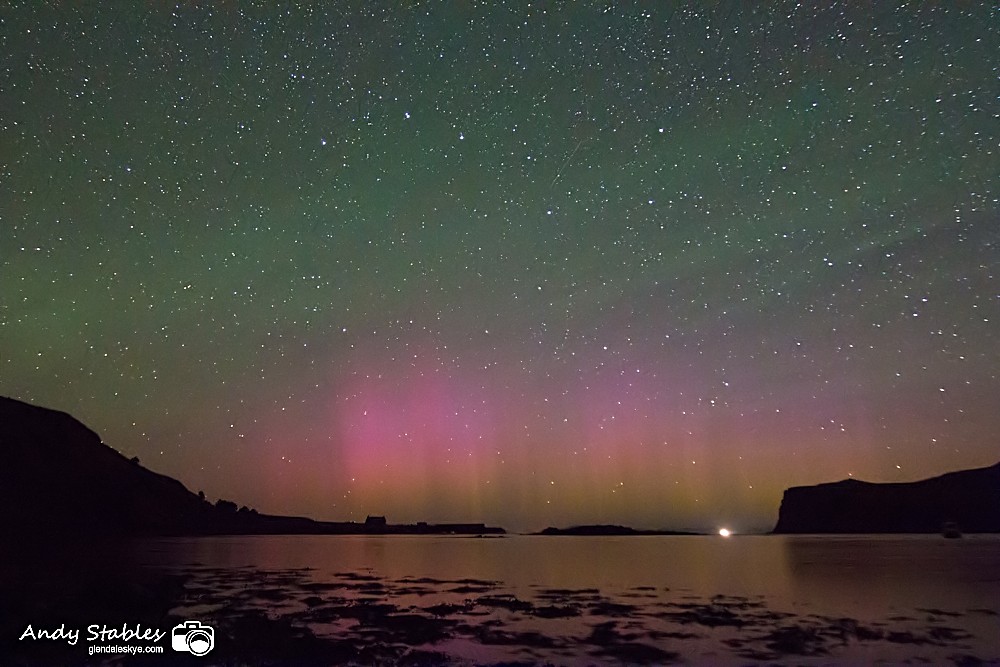
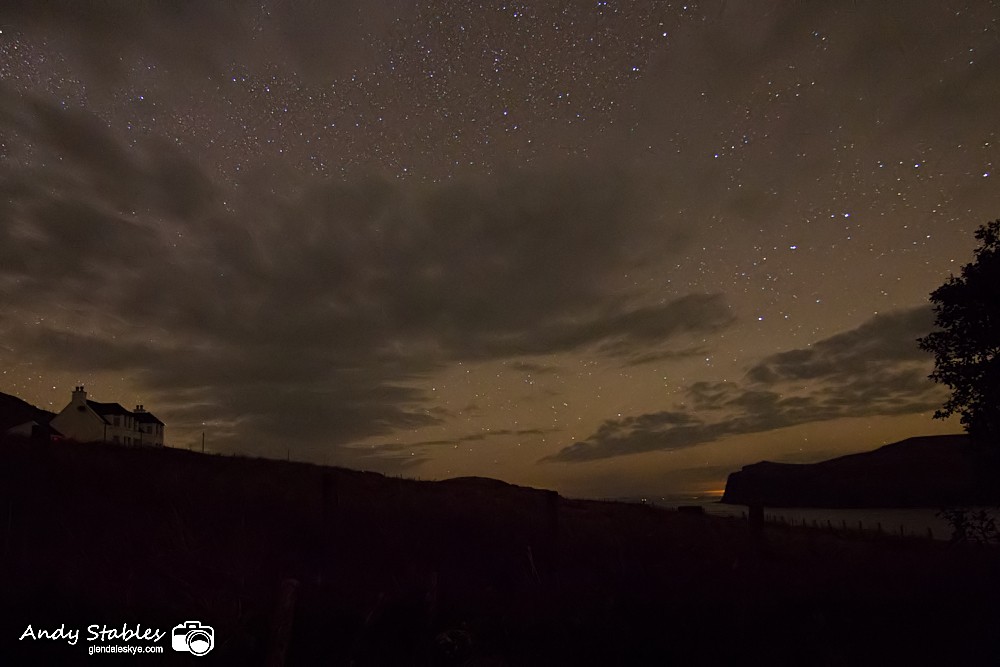
2 of 4 : 19:48 UT - Diffuse Aurora
Growth Phase
Now let's take a look at a photo taken during the Growth Phase at the point when the magnetometers have climbed to their highest point. Obviously, we do not know that we are at the highest point at this time but you can see that we now have a very strong diffuse aurora whose top is touching 15 degrees above the horizon.
You can clearly see that there is no green component in the aurora yet, so we are definitely in the growth phase of a geomagnetic substorm.
As we continue to monitor the stackplot trace at Andenes, we see that it now starts to descend slowly, at the same rate as it increased. By 20:00 UT, we can see that we have passed the peak and estimate that the line will be back to zero some time between 20:30 UT and 21:00 UT.
This means that we can predict 30-60 minutes before the Expansion Phase begins when it will start.
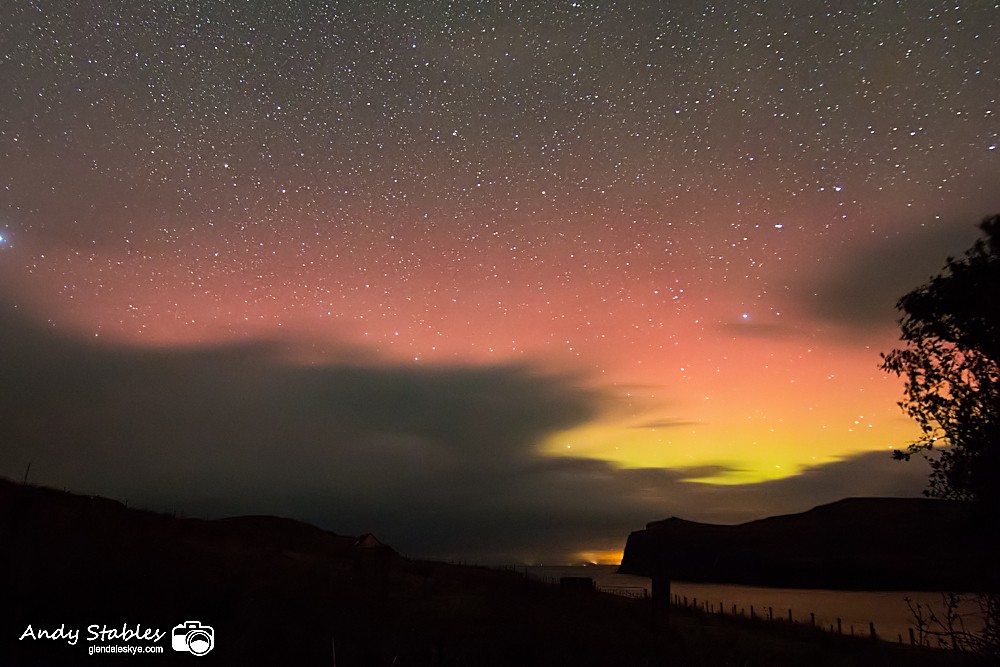
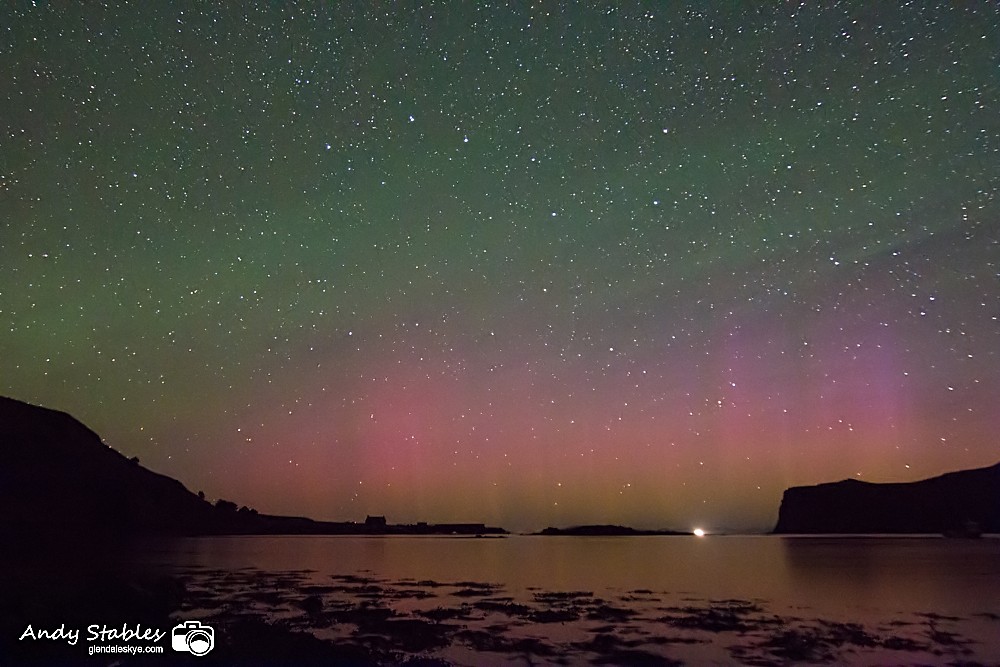
3 of 4 : 20:43 UT - Discrete Aurora
Expansion Phase
This photograph shows why we aurora-hunters are trying to predict the beginning of the Expansion Phase. The expansion phase started at 20:40 UT and within a few minutes the aurora has exploded, with the red/pink top reaching 30-40 degrees above the horizon.
One other curious fact I have discovered about the diffuse auroras is that they define the elevation of the discrete, green arc in the expansion phase. Almost an hour before it happens, we are able to predict that the green arcs are going to extend up to 15 degrees when the show kicks off proper. In this case, I could predict in advance that it would be a good show and had put a warning out on the Glendale Skye Auroras Facebook Page at 20:00 GMT.
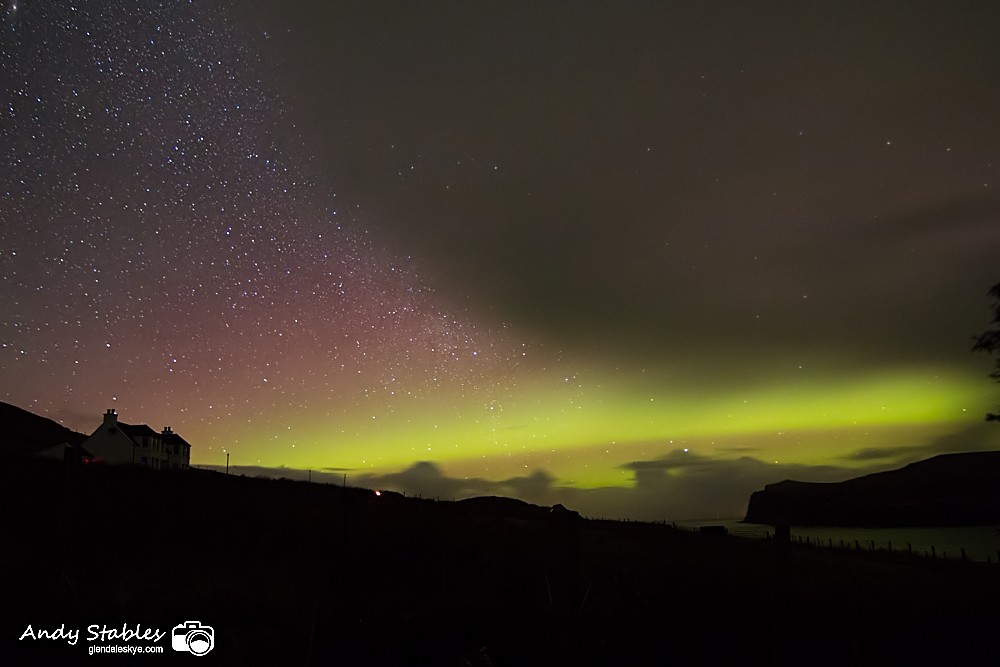
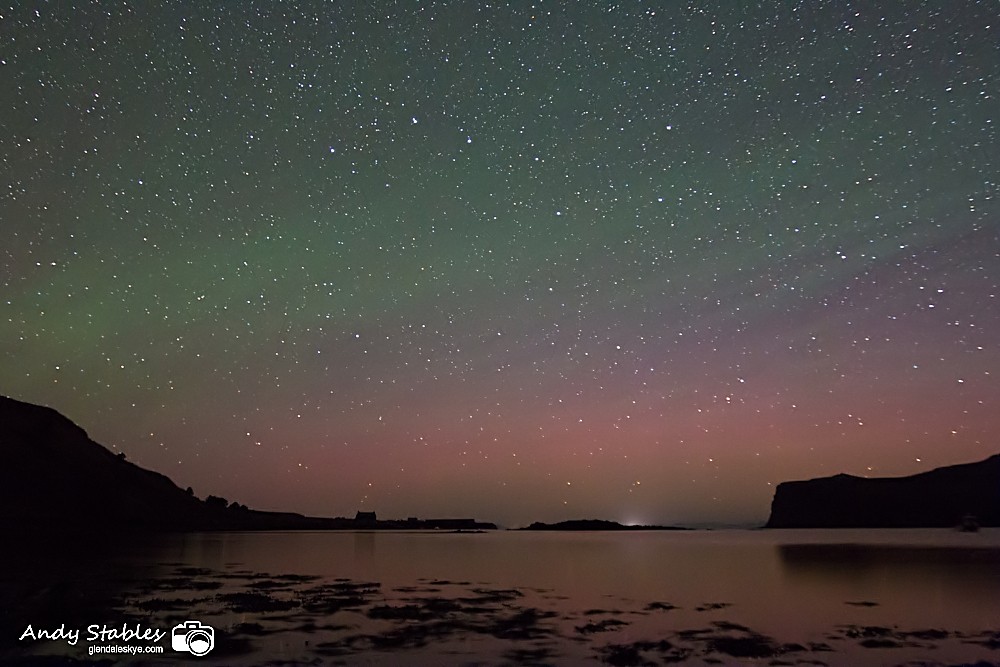
4 of 4 : 00:11 UT - Recovery Phase
Recovery Phase
Now we look at the sky 1.5 hours after the expansion phase ended. The magnetometers are at background levels at this time but there is still a strong, discrete aurora in progress.
With thanks to Dr. Steven Marple of the Lancaster University Physics Department and AuroraWatch UK for help with the scientific terminology in this article.
Background
I have been studying the growth phase for several years and captured hundreds of auroras. In order to provide 'control' shots, I shoot the sky every night from dusk until the early hours, weather-permitting, and I have done most nights, taking thousands of images at intervals of at least 10-30 minutes.
My ideal aim each night is capture a totally ambient sky, followed by all of the colour changes in the sky that precede a full-blown, discrete aurora.
This is extreme aurora-hunting. I am using long exposures and very high ISO to capture weak phases in the formation of auroras. It is only the benefit of a Northern horizon that is devoid of light pollution and advances in modern CCD sensor design over recent years that have made this work possible.
Control Photos
Ambient sky when no diffuse aurora is showing.
One question that arises is how can we be certain that these pink, diffuse auroras are actually 'auroras' and not a form of airglow?
The way that I resolve this is to photograph the sky constantly, every night to determine what a true ambient sky looks like. If we take photos of the night sky constantly, we can see that the diffuse aurora has a direct correlation with the magnetometer displacements on the Norwegian Line. It is impossible to have a discrete aurora without there being a diffuse phase first, although the transition time through the phases can be as low as 30 minutes. Obviously, we cannot capture the diffuse phases if the aurora is already in progress before nightfall.
The pink glow is never seen in the West, South or East, which can be confirmed by photographing those directions when we have the diffuse aurora showing on camera. In those directions, we will always get a green or beige bias towards the horizon. If you look closely at the images in Sequence 2, above, you will also notice that airglow is a completely different shade of green to that in the aurora. The greens in the aurora are more yellowy.
The pink, diffuse aurora also responds to changes in the solar wind. When the solar wind speeds are high, the elevation angle of the diffuse aurora above the horizon is larger. It is also a stronger colour when the density is high or the atmosphere is more receptive to the particles (Bz).
Another interesting fact I have observed is that there tends to be a very subtle bias in the elevation and colour of the diffuse aurora towards the East side of the arc in the early evening, which transits towards the West side of the arc as the night progresses. This corresponds to the rotation of the Earth through the night. It is well known that the impact zone for solar wind particles is largest on the opposite side of the globe to the Sun, i.e. that is the point where the ovation pushes furthest south.
NOAA have an ovation model that attempts to predict which latitudes the aurora is sitting between and also how far South it will be visible. What the pink, diffuse aurora is showing us here on the Isle of Skye is the actual outline of the ovation.
This article was written in 2014 by Andy Stables, who went on to create the world's only accurate aurora app. Glendale App is free to download at aurora-alerts.uk and works on all devices. It is not in the app store.